Portfolio Performance
The AIM portfolio made its first investments in December 1995. Since that time, the portfolio has outperformed both the Russell 3000 and the S&P 500 (with reinvested dividends) by approximately 242 basis points on an annualized basis. The annualized returns and cumulative performance of the AIM portfolio and its market benchmarks are described below (as of December 31, 2023).
- AIM Portfolio: 12.06%
- Russell 3000: 9.64%
- S&P 500: 9.56%
Investment Policies and Objectives
The AIM portfolio is comprised of approximately 25 publicly-listed stocks, with trading decisions made once per semester. The portfolio's target allocation is 65% large-cap stocks and 35% small and mid-cap stocks, with industry composition roughly matching that of the Russell 3000. Positions are adjusted each semester to be approximately equal weighted, with no position permitted to exceed 10% of the total portfolio value.
In keeping with University policy, the portfolio will not invest in any company whose values are inimical with those of the University of Notre Dame, or in the stocks of businesses involving abortifacients, abortion providers, birth control, human embryonic stem cell research, tobacco, pornography, or land mines.
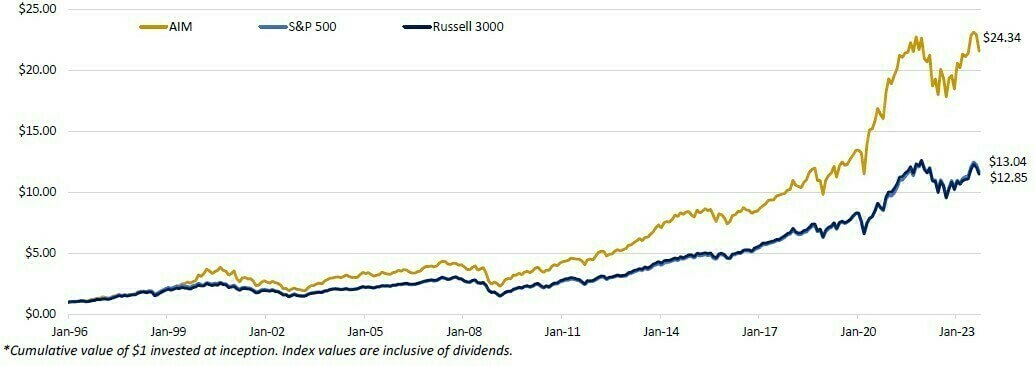
Cumulative Performance (12/31/1995 - 9/30/2023)
The graph shows the cumulative value of $1 invested at inception, where benchmark performance includes reinvested dividends.
Annualized Returns (as of 12/31/2023)
Trailing Period Returns for Portfolio and Benchmarks (%)
| Account/Benchmark | Market Value | YTD | 1 Year | 3 Years | 5 Years | 10 Years | Inception |
|---|---|---|---|---|---|---|---|
| AIM Portfolio | $31,177,313 | 19.22% | 19.22% | 9.09% | 17.46% | 13.18% | 12.06% |
| Russell 3000 Index | 20.82% | 20.82% | 10.99% | 14.30% | 12.62% | 9.64% | |
| S&P 500 Index | 19.15% | 19.15% | 9.10% | 13.53% | 11.96% | 9.56% |
*Benchmark returns include reinvested dividends and returns greater than one year are annualized. Inception date is 12/31/1995.